The Underlying DSRP Structure of System Dynamics
 Derek & Laura Cabrera
·
3 minute read
Excerpt from the book: Systems Thinking Made Simple, Chapter 8
System dynamics is a method that is popular, and for some types of systems—especially population models—system dynamics isvery powerful.
The basic idea behind system dynamics is a particular type of relationship called feedback. For the system dynamicist, feedback can be positive or negative (+/-) and there are two kinds of feedback loops: balancing and reinforcing.
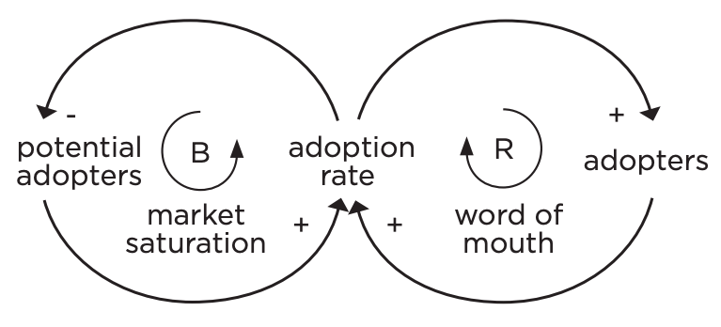
The example in Figure 8.18 shows two feedback loops that are interacting with each other. A reinforcing loop called "word of mouth" shows that more adopters means a higher adoption rate, which in turn means more adopters. The other feedback loop is a balancing loop because when potential adopters increases, the adoption rate climbs, but as the adoption rate climbs, potential adopters decline (because those who have adopted are no longer on the market to adopt). This balancing loop is called "market saturation." Next, systems dynamics adds the concepts of "stocks and flows" (Figure 8.19). You can see, for example, that the feedback loops above led to accumulations of potential adopters becoming actual adopters based on the adoption rate.

We can think of these accumulations as a "stock" (something akin to water collecting in a bathtub) and the rates as "flows" (akin to the amount that the faucet is open to allow water into the bathtub).
When we combine these basic elements of system dynamics modeling (feedback loops and stocks and flows) we get more complex diagrams (Figure 8.20) that show multiple feedback loops and cycles, stocks, and flows interacting in a system.
One of the powerful things that system dynamics software allows you to do is attach equations to these conceptual drawings and then model the dynamics of the system so that you can simulate real-world conditions.
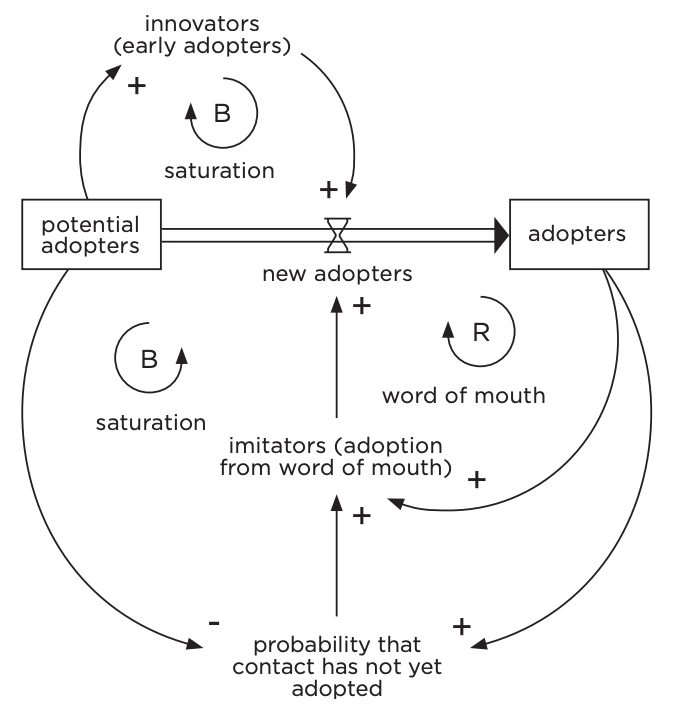
Now let's take a look at what underlies system dynamics. First, we have some distinctions (Figure 8.21). In a system dynamics diagram, the distinctions are the words and symbols (in orange):
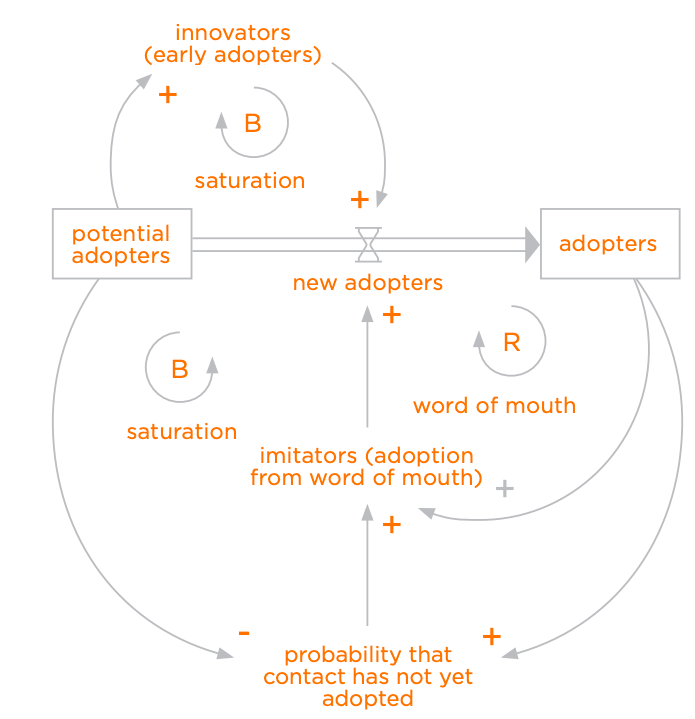
Figure 8.22 shows the relationships (usually directional) between the distinctions in black:
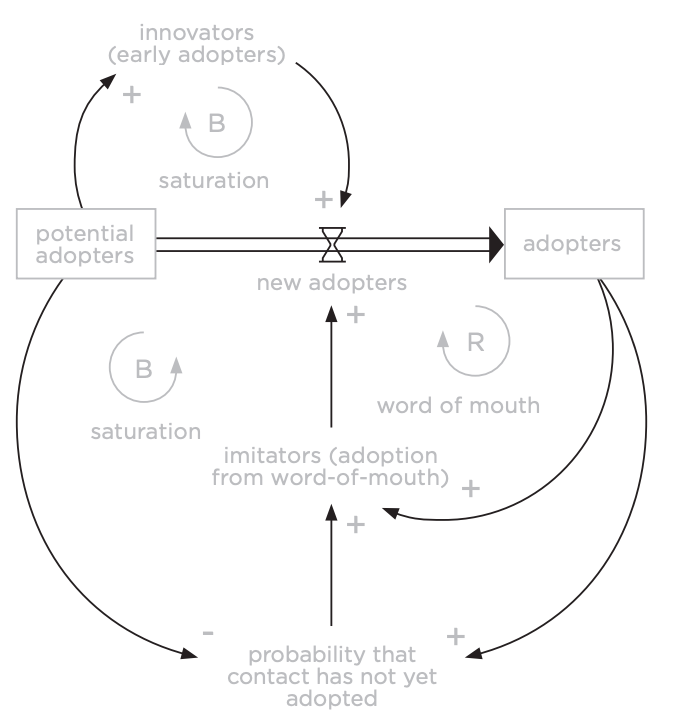
The astute observer will notice that these directional relationships usually have also been made into distinctions (i.e., they've been "identified"). These identifications almost always take the form of "+" or "-" (increasing or decreasing). So in system dynamics relationships are specified (shown in Figure 8.23).
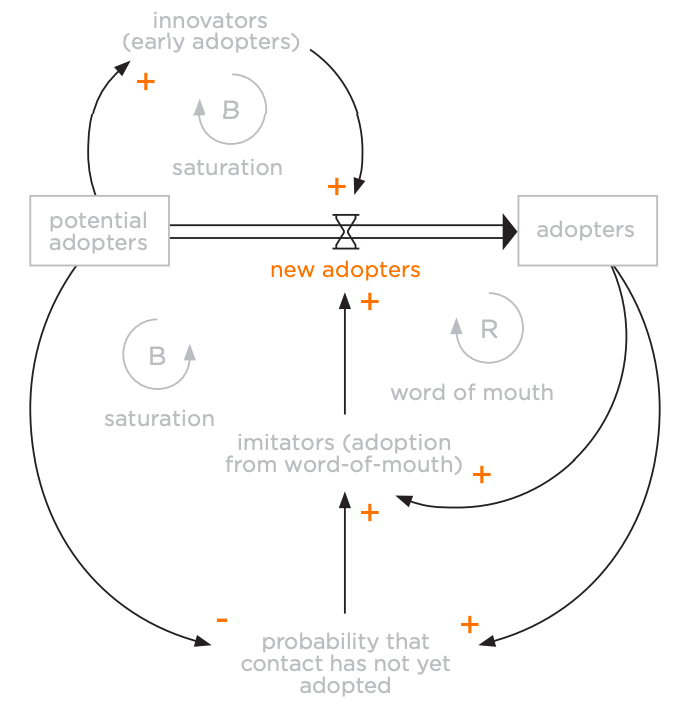
Now let's see where feedback comes in. Those relationships make up a lot of what system dynamics diagrams do. In fact, many "soft"3 system dynamics diagrams do not include stocks and flows, just feedback loops. In the case of these soft system dynamics diagrams, all we are doing is chaining together a specific type of relationship (feedback) with various distinctions.
Feedback, which is so central to system dynamics diagramming, is really a part-whole system made up of specified parts and relationships. You can see in Figure 8.24 that the "word of mouth" feedback loop is really nothing more than a system made up of three relational parts (black) between the potential structural parts (orange).
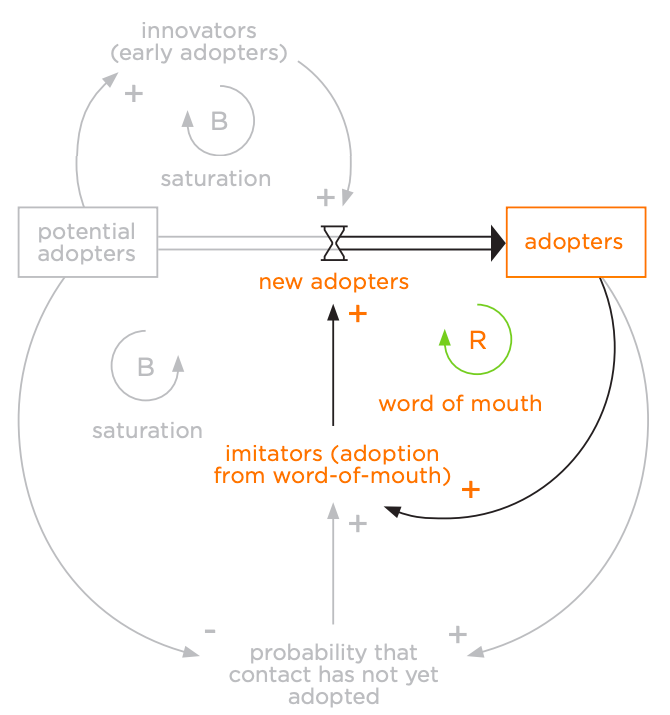
The reinforcing feedback loop called "word of mouth" (green) is just a whole system made up of these parts (black and orange). In the diagram in Figure 8.24, there are two other such feedback loops that have the same part-whole structure. All feedback loops are systems of relational and structural parts.
Applying DSRP rules to system dynamics also highlights an important distinction between balancing and reinforcing feedback loops (Figure 8.25).

Stocks and flows are a core part of many system dynamics diagrams. Flows are just another distinct type of relationship. In quantitative diagrams, this relationship can take a number (a rate). This rate means the relationship is being distinguished as a particular number (no different than distinguishing it with a name). The stocks are accumulations (i.e., a part-whole system). The scale used in every stock is simply a fractional scale based on whatever the stock is (e.g., 30/100 potential adopters). Like all mathematical fractions, stocks are another example of a part-whole system.
So the underlying structure of all system dynamics diagrams is:
- Distinctions (labels, stocks, flows, feedback);
- Relationships (individual directional relationships, flows);
- Systems (stocks);
- Systems of relationships and distinctions: (systems of directional relationships, i.e., feedback loops); and
- Distinguished systems: (balancing vs. reinforcing loops).
Noticeably absent as a structural component of all system dynamics diagrams are perspectives. Of course, there is always an implicit or root perspective that belongs to the creator of the diagram. Also absent, and particularly important, is an explicit recognition of the other in the identity-other distinctions that make up all of the labeling in a system dynamics diagram. When the user is forced to test the validity of the constructs through distinction methods such as NONG/MECE (see chapter 3), systems thinking using DSRP is more effective. In addition, system dynamics diagrams could do a better job of showing the hierarchical structures that naturally occur in complex systems. Most system dynamics diagrams are fat, meaning all of the parts are laid out. There is no zooming. Yet hierarchies and the boundary conditions that enclose them are real-world structures that account for many important dynamics.
Rather than limiting ourselves to the specialized types of systems, relationships, and distinctions of system dynamics, we can include any number of other relationships, distinctions, and systems that might be relevant. Remember also that when we add perspective, everything changes.
.png?width=150&height=150&name=CRL%20GOAT%20Logo%20(4).png)


