.png?width=150&height=150&name=CRL%20GOAT%20Logo%20(4).png)
 ·
2 minute read
·
2 minute read
Excerpt from the book: Systems Thinking Made Simple, Chapter 8
This blog is part of a set of blogs under the tag "cognitive jigs." Be sure to checkout the tag to read them as a group and learn how cognitive jigs are at play in our everyday lives.
Tables are another common organizational tool. From the periodic table of elements to a recipe for ganache, from kindergarten classroom routines to doctoral appendices, the time-tested, tried-and-true, trusted, and downright handy table is one of mankind’s favorite meaning-making devices.
You know of course that tables are made up of cells and the cells contain some type of data or information. These cells are arranged in columns (vertical cells) and rows (horizontal cells). The purpose of a table is to arrange the data in a way that gives it the meaning you are trying to communicate. The cells allow us to easily place data, and the arrangement of those cells in relation to one another is what gives the information meaning. Generally speaking, tables are great for quickly and easily laying things out that relate on two axes—the column and the row. But what does it all mean? Is there an underlying structure to tables that is fundamental? The answer is yes: DSRP.
The first thing to notice is pretty simple. Every cell is a distinction. That is, all the different pieces of data or information are distinctly different. Even if the content inside the cells is the same, the location of the cell makes them different.
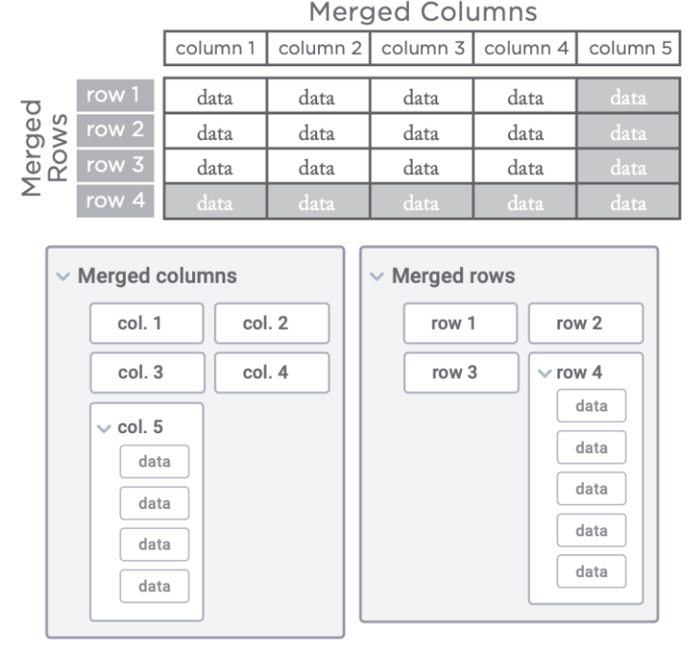
Next we can see that part-whole systems are implicit in table structure, because the columns and rows are natural groupings. The map in Figure 8.4 shows that merged columns, columns, and rows are just systems made up of parts. The map elucidates this structure using nestedness and size.
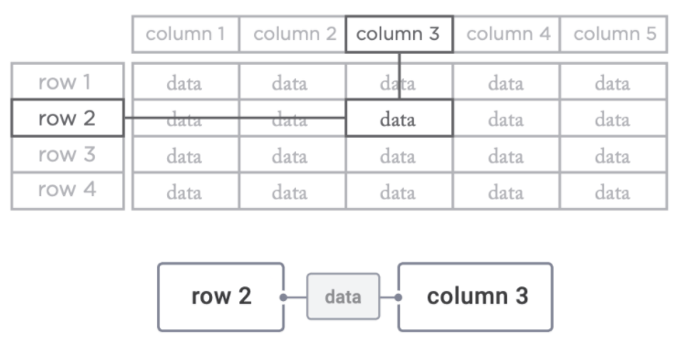
When we zoom in to individual cells in columns and rows, we see that like a graph, there are myriad Barbell-relationships. The data that lies at the intersection between a row and a column is actually the relationship between them. For example (in Figure 8.5), column 3 and row 2 are related by the data in cell 3, 2. All of the columns and rows are relational in this way, so we can think of a table as an elegant way of making lots and lots of barbell relationships.
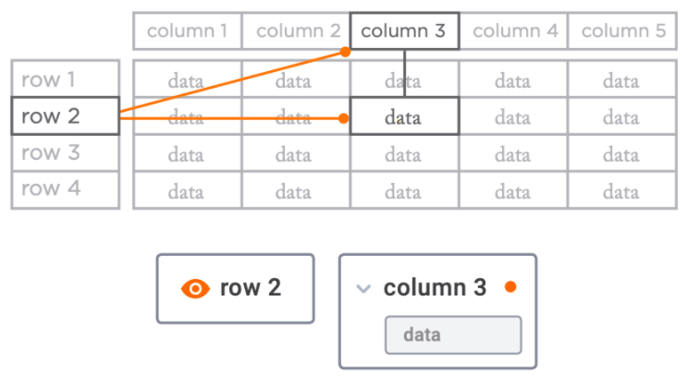
We can also use tables to create easy to understand P-Circles which we call P-Circle Tables where the items in one header column or row are looking at the items in another header column or row as in Figure 8.6.
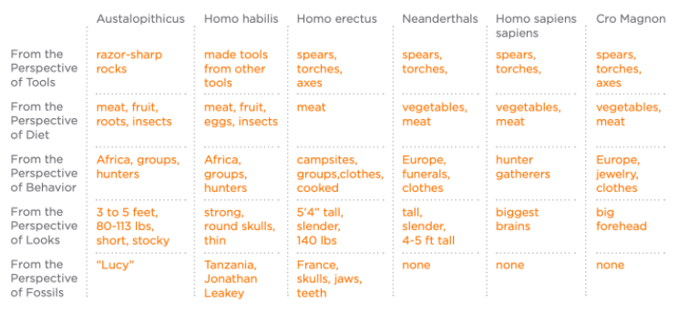
A simple example of what perspective tables look like is helpful. Table 8.1 illustrates a 5th grade Early Hominids project using a P-Circle in table form. This table shows early hominids (e.g., Australopithecus, Homo habilis, Homo erectus, Neanderthal, Homo sapiens sapiens, and Cro magnon) being looked at from multiple perspectives (e.g., tools, diet, behavior, looks, fossils). For example, when we look at Australopithecus from the perspective of tools we can see that they had razor sharp rocks, but when we look at Homo habilis from the same perspective, we see that they were making tools from other tools.